
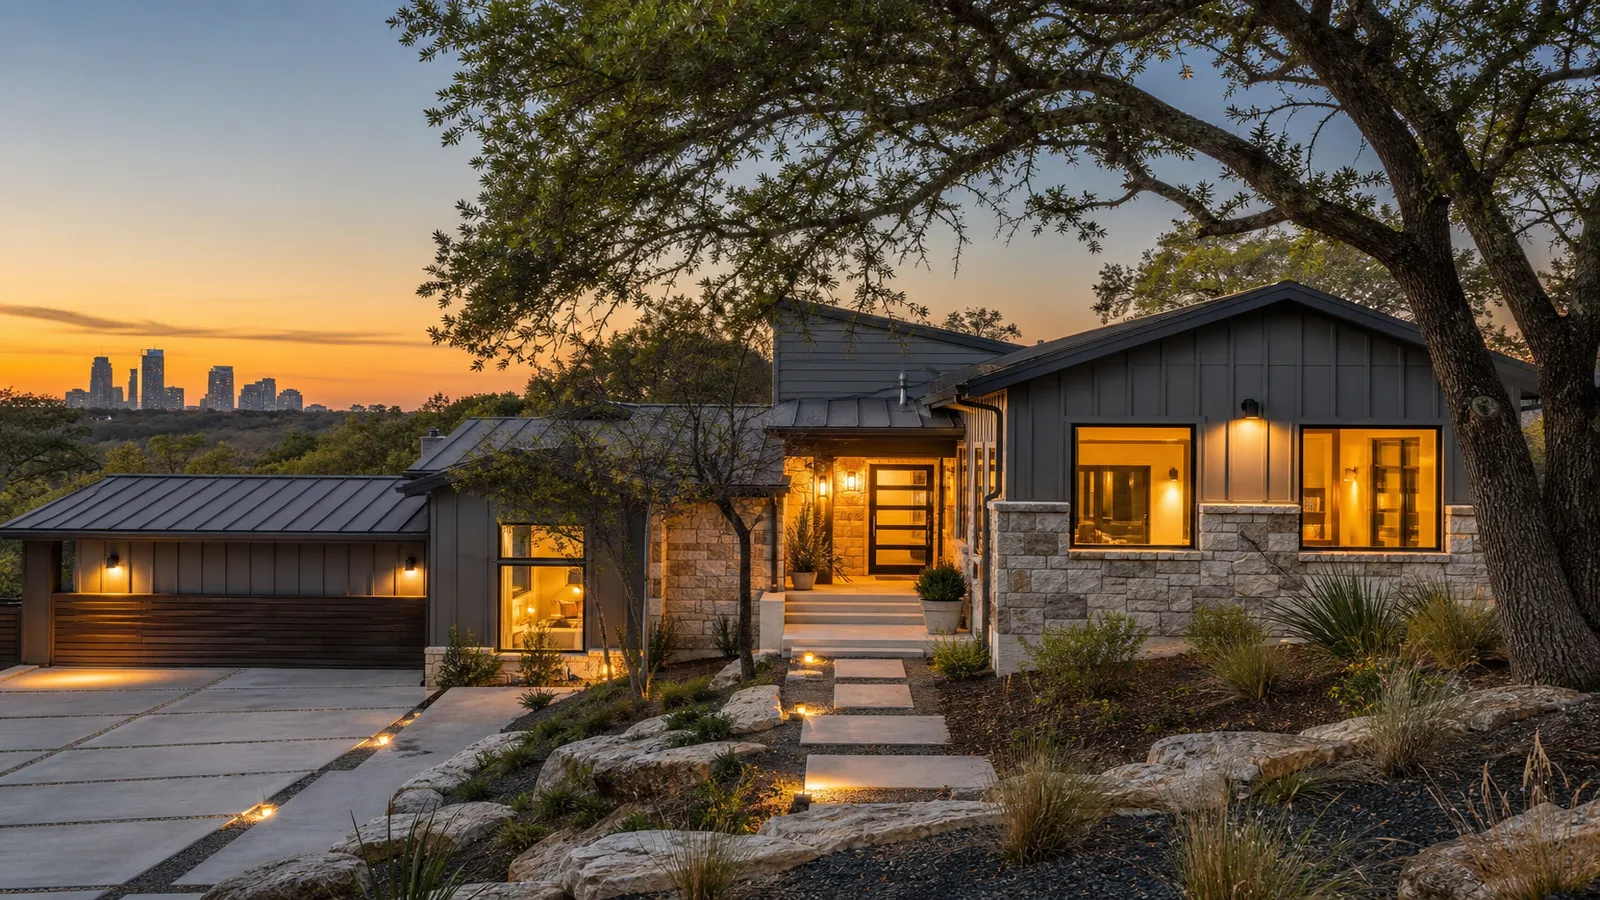
How much can you make on Airbnb in Austin? It is the first question almost every owner asks us about Airbnb income in Austin, and the honest answer is a range rather than a number. Austin is a large, event-driven short term rental and vacation rental market where a hill country vacation rental with a pool can gross six figures and a small downtown condo can land near $30,000 in total revenue. Gross revenue that far apart in one metro is normal here. The typical Austin listing produced about $41,291 in gross revenue over the last twelve months, and entire-place Airbnb listings averaged $44,883 in annual Airbnb revenue.
This guide walks through the real numbers for Airbnb in Austin, pulled from Surge short term rental market data in August 2026, so you can build a revenue estimate for your specific property instead of guessing from one citywide average or a generic Airbnb calculator. We also cover what comes off the top, including the 17% combined hotel occupancy tax and the City of Austin short term rental licensing rules that got real enforcement teeth on July 1, 2026.
Quick Answer: How Much Can You Make on Airbnb Austin Owners Should Expect
Here is the short version of the real earnings data for short term rentals across the Austin market:
- Average annual revenue, all listings: about $41,291
- Entire-place listings: about $44,883
- Houses: about $52,575 per year by property type; apartments and condos: about $31,241
- Average daily rate ADR: $215.76 across all listings, $236.57 for entire homes
- Average occupancy rate: 57.8% market wide
- Revenue growth: roughly flat year over year, about +0.3%
- Active listing count: about 24,368 short term rentals across 46 submarkets
That works out to average monthly revenue near $3,740 for a typical entire-place listing. Top operators, the ones with strong photos, dynamic pricing and fast guest communication, routinely earn 1.5x to 2x the market average in the same market with the same property type. The spread between a good Austin Airbnb and an average one is wider than the spread between neighborhoods.
One caveat before you run the math. The Austin market is a metro definition, not the city limits. It includes Dripping Springs, Wimberley, Lake Travis, Georgetown and Bastrop County towns, and those areas behave very differently from Downtown Austin. We break the submarkets apart below.
Key Metrics: Average Annual Revenue, Average Daily Rate and Occupancy Rate
Four numbers drive every set of revenue estimates for short term rentals in Austin, and they explain most Airbnb host earnings differences. Learn them once and you can evaluate any property in about ten minutes.
Average Daily Rate
The average daily rate is what a listing actually books at, not the rate you post. Across the Austin market the average daily rate is $215.76 for every active listing and $236.57 for entire homes. Professionally managed listings book at $248.58, about 5% above the entire-home average and about 15% above the all-listing average. Luxury tier properties book at $502.84 a night.
That professionally managed gap is the clearest pricing argument in this market. Austin demand swings hard around SXSW, ACL Festival, F1 weekend at Circuit of the Americas and University of Texas home games. Rates set once and left alone give away most of the upside on those weekends and then sit empty in January.
Occupancy Rate and Average Nightly Rate
Market wide occupancy rate is 57.8%, or about 211 booked nights a year, and that occupancy rate holds up well against other Airbnb markets. Entire homes run 57.5%. Average length of stay is 4.65 nights and average booking lead time is 39.5 days, which is a longer runway than most Texas markets and reflects how much Austin travel is planned around events and conferences.
A 57.8% average occupancy rate is a healthy floor, not a ceiling, and it beats most urban markets in Texas. Well run Airbnb listings in South Lamar, East Riverside and Downtown Austin clear a 60% occupancy rate or better because they price down into midweek gaps instead of holding out for weekend rates.
Average Annual Revenue and Gross Yield
Average annual revenue is the number owners care about most, and it is the figure the city assumes when it sets the 11% hotel and motel occupancy tax rate: $41,291 across all listings, $44,883 for entire-place listings, $52,575 for houses and $31,241 for apartments and condos. The house versus apartment gap of roughly $21,000 a year is the single largest property level difference in the Austin data, and it is why a three bedroom house in Oak Hill outperforms a downtown studio even at a lower nightly rate.
Revenue Growth and Supply
Austin revenue per listing is essentially flat year over year, up about 0.3% over the last twelve months compared with the twelve before. That is the market maturing after several years of fast growth. With roughly 24,368 active listings, new supply is absorbing new demand, so revenue gains now come from operations rather than from the rising tide. Owners who treat Austin as a 2021 style appreciation play are usually disappointed. Owners who treat it as an operating business do fine.
Airbnb Income by Austin Submarket: Where Airbnb Hosts Earn Most
Location drives the spread in Airbnb income. Here are annual revenue, average daily rate and occupancy for a representative set of submarkets in the Austin market.
| Submarket | Annual revenue | ADR | Occupancy |
|---|---|---|---|
| Westlake Hills | $92,767 | $670 | 50.7% |
| Steiner Ranch | $66,954 | $441 | 53.9% |
| MLK and 183 | $52,871 | $281 | 60.1% |
| Dripping Springs | $52,462 | $412 | 42.2% |
| East Downtown Austin | $51,152 | $278 | 59.4% |
| Wimberley | $50,729 | $352 | 44.6% |
| Barton Creek | $49,890 | $308 | 51.0% |
| Lake Travis | $46,892 | $327 | 47.0% |
| Oak Hill | $46,457 | $271 | 55.5% |
| Old West Austin | $45,717 | $262 | 59.2% |
| South Lamar | $45,553 | $241 | 62.5% |
| Downtown Austin | $41,134 | $217 | 60.2% |
| East Riverside | $39,490 | $195 | 62.0% |
| West Congress | $35,722 | $186 | 60.4% |
| Manor | $20,987 | $126 | 56.4% |
| Elgin | $19,277 | $133 | 44.6% |
Two patterns matter here. First, the top of the table is a different business. Westlake Hills and Steiner Ranch revenue comes from large luxury homes with pools and lake access booked by groups, not from higher occupancy. Second, the highest occupancy in the Austin market sits in the walkable central submarkets, South Lamar at 62.5% and East Riverside at 62.0%, where nightly rates are moderate but the calendar stays full. If you want steady cash flow, buy occupancy. If you want big swings and big peaks, buy the hill country.
Seasonality: Austin Earns in Bursts
Austin is less seasonal than a beach market but far from flat. Average revenue per listing by month over the last year:
- March: about $4,191 per listing, the SXSW peak
- July: about $3,999
- June: about $3,869
- October: about $3,936, driven by ACL and F1 season
- January: about $2,442, the annual low
March runs about 72% above January. That is the single most important planning fact for an Austin owner: you cannot pay annual expenses out of first quarter income alone, and you cannot leave March and October pricing on autopilot. Roughly a third of the year's profit is decided over about eight event weekends.
What You Actually Keep After Costs and Taxes
Gross revenue is not income, and operating costs decide what an average Airbnb host actually banks. Here is a realistic annual cost stack for an entire-place Austin listing grossing $44,883.
| Line item | Typical annual cost |
|---|---|
| Cleaning (usually passed to guests) | $0 to $2,000 net |
| Property management, 20% of gross | $8,977 |
| Utilities, internet, streaming | $3,600 |
| Supplies and consumables | $1,400 |
| Repairs and maintenance | $2,200 |
| Short term rental insurance | $1,800 to $3,500 |
| Furnishing replacement reserve | $1,500 |
| City license, amortized | about $193 a year on renewal |
Local property taxes and the mortgage sit on top of those operating costs and vary too much to average. Note what is not on the list: the hotel occupancy tax. Guests pay it, you collect and report it, and it never belongs to you.
Operating Expenses, Net Income and Gross Yield for an Airbnb Property
Airbnb hosts who only track total short term rental revenue get surprised in April. Total revenue of $44,883 on an entire-place Austin property typically leaves net income of roughly $16,000 to $22,000 before mortgage and property taxes, depending on management costs, cleaning costs and how much of the cleaning fee you pass through to guests. On a $525,000 purchase price that is a gross yield near 8.5% and a much thinner net yield, which is exactly why the purchase price you pay matters more than any pricing optimization you do later.
Platform fees also come off the top. Airbnb charges hosts a host-only service fee on most professionally connected listings, so build that into your operating expenses rather than assuming the guest covers everything. Management fees for full service short term rental management in Austin generally run 15% to 25% of gross revenue, and cleaning costs are usually recovered through the guest cleaning fee. Ask any manager how many properties managed in Austin they run, since local density is what makes those management fees worth paying.
The 17% Hotel Occupancy Tax and Local Occupancy Taxes
Austin short term rentals carry a combined 17% hotel occupancy tax: 11% to the City of Austin, made up of a 9% occupancy tax plus a 2% venue project tax, and 6% to the State of Texas. The city rate is published on the City of Austin hotel occupancy tax page, and the state portion is administered by the Texas Comptroller.
The Airbnb platform and the other booking sites collect and remit occupancy taxes for you. That does not end your obligation. Austin still requires short term rental owners to file a quarterly report showing what each platform collected and remitted on their behalf, and revenue from direct bookings or offline channels must be collected and remitted by the owner directly. If there were no rentals in a quarter, a zero report is still required.
Austin Short Term Rental Rules You Have to Budget For
Austin rewrote its short term rental rules and then started enforcing them. The current framework, published by Austin Development Services, works like this:
- A license is mandatory in all residential zoning districts. Since February 2025 short term rentals are an accessory use allowed anywhere residential, provided the license is valid.
- Licenses now run two years instead of one. A new operating license costs $836.30, which is a $789 license fee plus a $47.30 notification fee. Renewal is $385.30.
- Platform enforcement started July 1, 2026. Platforms must display a license field and remove unlicensed listings when the city asks. An unlicensed Austin listing is now a listing that can disappear.
- A local contact must live in the Austin metro area (Travis, Williamson, Hays, Bastrop or Caldwell County) and be able to respond within two hours of an emergency notification, at any hour.
- Density limits apply. Up to two units on a single family site, the greater of one unit or 25% of units on mixed use sites, and the greater of one unit or 10% on multifamily sites.
- Neighbors get notified within 100 feet at every issuance and renewal, and a guest information packet must be posted inside the unit.
For an out of town owner, the two hour local contact requirement is the line that decides the question of self management. A friend with a spare key is not a plan at 2am on an F1 weekend, and the license is what the whole revenue model rests on.
Three Realistic Austin Scenarios
One bedroom condo, Downtown Austin
Downtown Austin averages $41,134 a year at $217 ADR and 60.2% occupancy, but that figure includes larger units. A one bedroom condo realistically books 200 to 215 nights at $150 to $180, so plan on $30,000 to $38,000 gross. HOA rules are the real risk here, not demand: confirm short term rentals are permitted in writing before you buy.
Three bedroom house, South Lamar or East Riverside
This is the workhorse Austin rental property. Expect $45,000 to $55,000 gross at 60% or better occupancy, with steady midweek business travel and a strong event calendar. Houses average $52,575 across the market, and central location plus a good backyard is the combination that holds occupancy in January.
Four to five bedroom home with a pool, Lake Travis or Dripping Springs
The upside cases for Airbnb income potential live here, and peak season carries them. Lake Travis averages $46,892 and Dripping Springs $52,462, with occupancy in the low 40s, so revenue is concentrated in spring and summer group bookings at $300 to $600 a night. Westlake Hills demonstrates the ceiling at $92,767. Budget for pool service, higher insurance and a longer vacancy tail from November through February.
What Separates Top Earning Austin Airbnb Listings
The gap between the market average and the top quartile is rarely the Airbnb property itself. It is a short list of controllable things:
- Event pricing. SXSW, ACL, F1 and UT football weekends should be priced weeks ahead at multiples of your base rate, with minimum stays that match how those guests actually travel.
- Photography. Airbnb in Austin is a saturated market at 24,368 short term rentals. The first photo decides whether a guest ever sees your rate.
- Response time. Fast replies raise conversion and protect ranking on the platforms.
- Midweek strategy. The central submarkets clear 60% occupancy because they discount Monday through Wednesday instead of defending a weekend rate.
- Amenities that match the guest. Pools and hot tubs in the hill country, where peak season demand is significantly higher, parking and walkability downtown, fast internet everywhere.
- Direct bookings. A repeat guest booked direct is worth more than a new one at the same rate.
If you want to show guests exactly what is walkable from your door, our free Airbnb attraction map maker builds a listing photo map with real walk and drive times to nearby spots.
Pricing Strategy: Where Airbnb Income Is Won or Lost
Static pricing is the most expensive mistake in this market. Two vacation rentals of the same property type on the same Austin block can be $12,000 a year apart purely on pricing strategy. Dynamic pricing tools such as PriceLabs or Wheelhouse read local demand, competitive pricing across comparable properties and event calendars, then move your rate daily. In an event driven city that is not a luxury, it is the baseline.
A workable approach for Austin:
- Set a base rate from three to five comparable properties of the same bedroom count and property size, not from the citywide average nightly rate.
- Layer event pricing on top for SXSW, ACL, F1 and UT home games, set at least 90 days out.
- Discount midweek gaps aggressively for business travelers, who book short lead time stays in central submarkets.
- Use orphan night rules so a two night hole between bookings does not sit empty.
- Review your review count and search ranking monthly; new Airbnb listings need early bookings more than they need top dollar.
Using Airbnb Data to Estimate Your Own Property's Income Potential
Free Airbnb calculator tools ask for a property address and property size and hand back a single number. They are a starting point, not an underwriting model, because an Airbnb calculator cannot see your zoning restrictions, your HOA, your bedroom count relative to real sleeping capacity or your actual management costs. Use real performance data from every comparable active listing near you, then adjust. An Airbnb calculator is a sanity check on your own revenue estimates, not a substitute for them.
- Start with the submarket revenue figure from the table above, not the citywide average.
- Adjust for property type and property size: houses run well above the average, apartments and condos well below.
- Adjust for bedrooms. Each additional bedroom that adds real sleeping capacity moves revenue more than any decor upgrade.
- Multiply your realistic ADR by 200 to 215 nights for a central property, or 150 to 175 nights for a hill country or lake property.
- Subtract the cost stack above, then subtract the mortgage and annual tax bill.
- Sanity check the revenue potential against three or four comparable active listings with real review volume.
If the deal only works at top quartile performance in year one, it is not a deal. Model the market average, then treat better operations as upside on your revenue potential.
Is an Airbnb Profitable in Austin for Real Estate Investors?
For real estate investors comparing markets, Austin sits in the middle of the Texas map on revenue and near the top on occupancy. The Austin market is more expensive to buy into than Houston or San Antonio, so profitable Airbnb investments here usually come from one of three angles: a house rather than a condo, a hill country property with a pool that commands peak season group rates, or a central Airbnb property that holds a 60% occupancy rate all year. Owners with multiple properties often pair one of each.
Compared with other Airbnb markets in Texas, Austin has the highest average earnings among the big metros on entire-home ADR, but the flat revenue growth means a potential Airbnb investment has to pencil on today's numbers. Zoning restrictions are no longer the obstacle they were, since short term rentals are permitted in residential districts with a valid license, but the licensing and reporting burden is real and it is one of the key factors owners underestimate.
Frequently Asked Questions
Is Austin a good market for Airbnb in 2026?
Yes, for operators who run it as a business. Occupancy at 57.8% is among the strongest in Texas and the event calendar creates repeatable rate spikes. But revenue per listing is flat year over year against 24,368 competitors, so gains come from pricing and guest experience, not from the market lifting you.
How much does an Austin short term rental license cost?
A new operating license is $836.30 and renewal is $385.30, and licenses are valid for two years. Platforms began removing unlicensed listings at the city's request on July 1, 2026.
Do I owe hotel occupancy tax if Airbnb collects it?
Airbnb remits the 17% for platform bookings, but Austin still requires you to file a quarterly report of what each platform collected, and to remit tax yourself on direct or offline bookings. A zero report is required for quarters with no rentals.
Which Austin neighborhood earns the most on Airbnb?
Westlake Hills leads on revenue at $92,767 a year on luxury homes. On occupancy, South Lamar at 62.5% and East Riverside at 62.0% lead the market, which usually means steadier cash flow for a smaller purchase price.
How much Airbnb income can a house earn compared with a condo?
Houses average $52,575 a year in gross revenue for Airbnb in Austin versus $31,241 for apartments and condos, a gap of about $21,000.
Should I self manage or hire a property manager?
The math turns on two things: whether you can meet the two hour local contact rule, and whether you will actually reprice for every event weekend. Professionally managed listings book at $248.58 a night against a $236.57 entire-home average, and the difference usually covers a large share of the management fee before you count the time saved.
Quick Answers
- Average annual Airbnb revenue in Austin: $41,291 a year, $44,883 for entire places
- Average daily rate: $215.76 all listings, $236.57 entire homes
- Occupancy: 57.8%, about 211 nights
- Best occupancy submarkets: South Lamar 62.5%, East Riverside 62.0%
- Highest revenue submarket: Westlake Hills $92,767
- Combined hotel occupancy tax: 17%
- License: $836.30 new, $385.30 renewal, valid two years
Data in this guide comes from Surge market data for the Austin market pulled in August 2026. If you want a property specific projection, or you want the licensing and two hour contact requirement for your specific property handled for you, our team manages Austin short term rentals and vacation rentals for owners across our markets. See our breakdown of the best Airbnb management companies in Austin or compare with Houston revenue data.
Comparing Texas metros? See how much you can make on Airbnb in Dallas.
Comparing Texas markets? See how much you can make on Airbnb in San Antonio.

Written by
Humberto MarquezFounder, Surge
Founder of Surge and licensed Texas real estate broker. Manages short-term rentals across 12 U.S. markets and invests in STRs himself. Quoted in Martha Stewart, Yahoo Finance, Realtor.com, Bob Vila.
More about Humberto →See what your property could earn with Surge
Full-service short term rental management across Texas and Florida. Get a free property assessment and revenue estimate, no commitment.